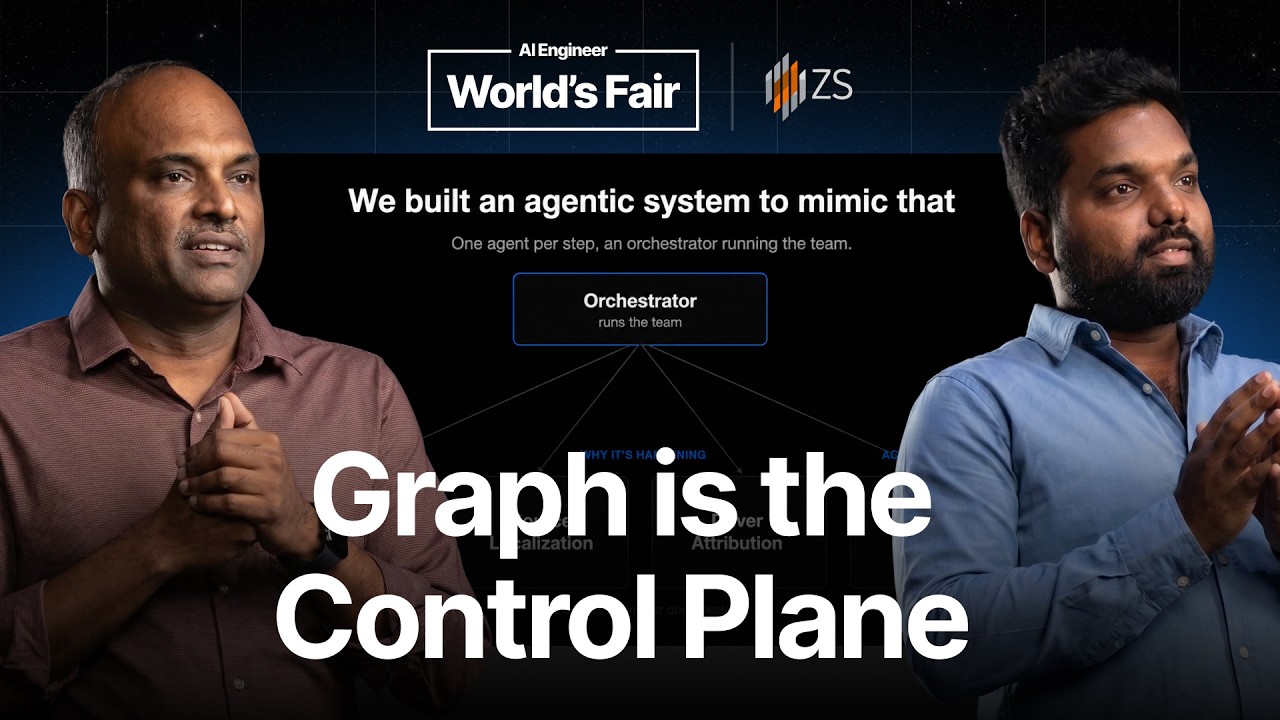
ZS Associates found that assigning a separate agent to signal detection, localization, cause analysis, and synthesis produced disconnected answers because no agent owned the full reasoning chain.
2
The rebuild moved signal detection into a deterministic workflow, then gave a single agent responsibility for investigation and judgment, with sub-agents handling focused lookups when needed.
3
A pharma knowledge graph bounds the agent's investigation by defining entities, relationships, and hypotheses that the agent tests against the underlying data.
Summary
Subbiah Sethuraman and Abhilash Asokan describe how ZS Associates replaced a multi-agent pharma analytics pipeline with a smaller architecture. The original system copied an analyst's four steps into separate agents, connected by an orchestrator. It could find the right cause for a prescription decline, then suggest an action that did not address that cause, because context and business meaning were lost between handoffs. The rebuild began with an empty directory, Claude Code, bash, the database, and a real signal. Signal detection became a deterministic pipeline with statistical methods, thresholds, guardrails, and prioritization. A single agent now owns the reasoning, while sub-agents perform focused investigations and return results. A knowledge graph gives the agent a bounded set of paths and hypotheses to test against data. The speakers say this approach can produce work in about 20 to 30 minutes that previously took an analyst three or four weeks.
Pharma commercial analysts move from a signal to an action
The speakers describe four steps in commercial pharma analytics. An analyst first detects a signal, such as a decline in a doctor's prescriptions. The analyst then investigates why it happened, which could involve a competitor, payer coverage, or field-rep activity. After finding a cause, the analyst chooses an action, such as changing rep coverage in a region. The final step is to estimate the outlook and ask whether the action should improve brand or sales performance. This workflow became the model for ZS Associates' first attempt at an agentic system.
One agent for each analyst step produced an answer with a broken chain of reasoning
ZS Associates built separate agents for signal detection, source localization, driver attribution, and synthesis. An orchestrator connected them. One example reported that prescriptions had fallen 18 percent in a territory over roughly four weeks because a payer moved the drug to a lower tier. That cause was plausible, but the recommended action was to send more sales reps to doctors. The action did not address insurance coverage, so the projected sales outlook also failed to follow from the cause. Each stage had found a reasonable fact, yet no single agent understood the complete situation.
The failure came from the architecture and the handoffs
The speakers say the language model was not the main problem. Signal detection used a language model for a task that could be handled with statistical methods. The pipeline also passed context from one agent to another, and important meaning disappeared during those handoffs. The synthesis agent did not retain the significance of a payer making the drug more expensive. The agents also lacked shared pharma knowledge, including the meaning of TRX, which refers to the number of prescriptions a doctor writes, and the relationships among business metrics. Splitting the work had separated facts from the judgment needed to connect them.
The rebuild started by observing an agent in an empty directory
Instead of redesigning the topology, tools, schemas, or handoffs on paper, the team opened a plain empty directory and ran Claude Code with bash and access to the database. They supplied it with an actual signal and watched its actions. This let them see how the agent wrote functions and queried the database. The observation led to a lighter design. The speakers used the agent's behavior as evidence about which work should remain with an agent and which work should be moved into a separate workflow.
Signal detection became deterministic before the agent starts
The rebuilt system does not ask an agent to decide whether a signal exists. An automated pipeline scans the data for KPI anomalies and broken trends. It applies statistical methods, thresholds, guardrails, and prioritization, then puts identified signals on a queue. The agent wakes up when a signal arrives. Its job is to investigate the signal rather than guess whether the data contains one. This division removes a variable judgment from the agent and gives the investigative process a defined starting point.
One agent owns the judgment while sub-agents handle focused investigations
The team consolidated the process into one main agent because separate agents created incoherent outputs. This does not eliminate parallel work. The main agent can give a narrowly defined investigation to a sub-agent, such as checking activity in a particular region. The sub-agent returns findings, while the main agent retains the reasoning and judgment. The distinction is between distributed investigation and distributed decision-making. The speakers wanted the former when useful, while keeping the latter under one agent that can follow the entire case.
The knowledge graph bounds the investigation as a control plane
The team built a pharma knowledge graph with domain experts. It maps geographic entities, payers, accounts, brands, KPIs, and relationships among primary, secondary, and tertiary KPIs. The graph is not merely a place to look up data. It defines which entities and paths the agent can investigate and which hypotheses it can evaluate. If TRX declines nationally, the graph guides the search through regions, territories, payers, or accounts. Once the agent finds where the decline is concentrated, KPI relationships guide the search for why it happened.
Every graph edge becomes a hypothesis tested against the source data
The agent starts with an entity, inspects its neighborhood in the graph, and turns graph edges into hypotheses. It then returns to the original data, checks the actual numbers, and decides whether the evidence supports or contradicts each hypothesis. Supported findings allow it to continue through the graph. The loop ends when the agent finds the root cause or runs out of hypotheses. The speakers say that after more than 50 turns and many tokens, this process can produce work in about 20 to 30 minutes that previously took an analyst three or four weeks.