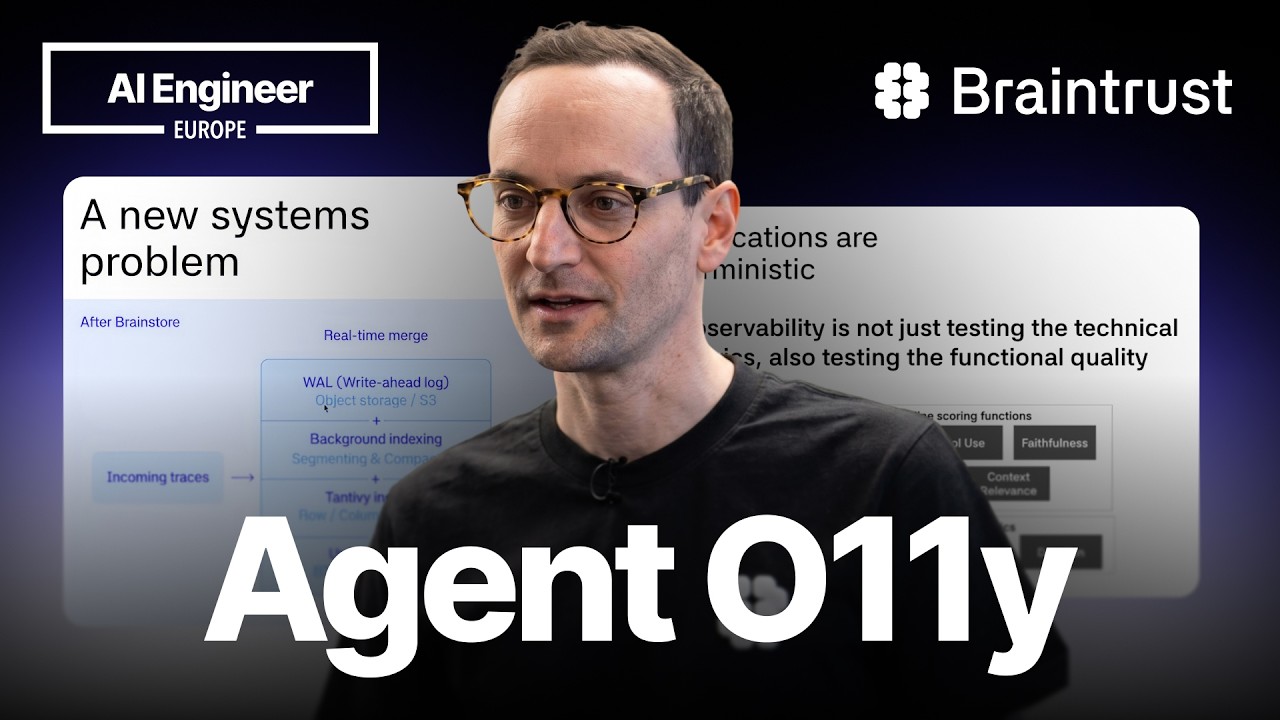
Traditional observability measures whether an application is up and technically responsive, while agent observability also measures the quality and correctness of its responses.
2
Agent traces are much larger and less structured than traditional traces, so Braintrust built a database with a write-ahead log, analytical indexes, and full-text search.
3
Subject matter experts can grade agent traces and explain their judgments, then those explanations can become automated scoring functions.
Summary
Phil Hetzel separates traditional observability from agent observability by the questions each one answers. Traditional tools such as Grafana and Datadog measure uptime, latency, duration, and errors. Agents also require checks on whether their answers are grounded, whether they used the expected tools, and whether they follow a brand standard. Their non-deterministic behavior creates many possible paths, while traces can contain large amounts of semistructured data and unstructured text. Hetzel explains that Braintrust built a database for this workload, combining immediate writes, analytical indexes, and a fork of Tantivy for full-text search. Agent quality work also includes people outside engineering. Clinicians, nurses, lawyers, and wealth advisers can inspect traces, grade responses, and explain their decisions. Those explanations can inform automated scoring functions. Braintrust is also using lightweight language models for embeddings, clustering, topic modeling, sentiment, and issue discovery.
Traditional observability asks whether the system is operational
Hetzel defines traditional observability around uptime and technical performance. Engineers measure whether the application is up, whether interactions have acceptable latency and duration, and whether users encounter 400- or 500-level errors. Metrics such as latency and error counts can be aggregated over time. Traces describe a complete workflow interaction, while spans describe individual steps. Hetzel says Braintrust still uses Datadog for this use case because it is well suited to checking whether a service is operational.
Agent observability must measure response quality as well as speed
Agent systems still produce familiar technical metrics, including time to first token, total tokens, duration, and latency. They also need qualitative checks. An engineer may ask whether the response was grounded in the context gathered by the agent, whether the expected tools were used during reasoning, and whether the answer follows the agent's brand standard in its system prompt. Traditional observability tools generally lack enough information in their traces to compute these checks because the relevant context is much larger than a conventional observability trace.
Non-deterministic agent behavior creates a wider debugging problem
Hetzel says ordinary applications usually follow deterministic code paths and known control flow. Agents can take different paths because their behavior has more variety. That makes engineers interested in why an agent chose one route rather than another. Traditional observability can focus on constrained, known metrics. Agent observability has to cover a broader set of measurements because the same request may lead to different tool calls, model calls, and responses.
Agent traces are large, semistructured, and full of text
Hetzel describes agent traces as a difficult systems problem. They are highly semistructured and contain large amounts of unstructured text. An agent trace can exceed a gigabyte, and an individual span can reach 20 megabytes. Engineers still want to see these traces in real time as agents serve users. The system therefore has to ingest, process, and make useful a much larger and messier data shape without giving up immediate visibility.
The storage system has to support immediate reads and analytical queries
Braintrust designed a database specifically for agent traces because it needed to support different access patterns at the same time. A new interaction should become visible almost immediately. Engineers also need to run SQL or SQL-like queries, use the CLI, filter large trace sets, and analyze data for application improvements. Hetzel says the system writes data to a write-ahead log for fast visibility and builds indexes for filtering and analytical queries.
Full-text search lets engineers find words across entire traces
Agent traces contain enough text that ordinary observability indexing is not sufficient. Hetzel gives the example of finding every trace that contains the word Amazon. Braintrust uses a fork of Tantivy, an open-source Rust framework similar to Apache Lucene, to provide text indexing across traces. This lets engineers search the contents of prompts, tool calls, responses, and other trace data rather than relying only on fixed technical fields.
Subject matter experts can inspect and grade agent behavior
Agent quality work involves people who understand the users and the domain, not only systems or product engineers. Hetzel describes clinicians, registered nurses, wealth advisers, and lawyers opening traces, judging whether an agent responded correctly, and using what they see to improve it. Natural-language prompts make it easier for these subject matter experts to participate. Their domain knowledge can expose problems that an uptime or latency dashboard cannot identify.
Human explanations can become automated scoring functions
Hetzel explains the role of human annotation through a grading workflow. A product manager or domain expert can mark an agent response as good or bad and justify the judgment. Those written justifications can later be used with a language model to create scoring functions that run at larger scale. The human review finds failure modes first. Automated scores then help measure those failure modes across more traces.
Production traces can feed topic and issue discovery
Braintrust is beginning to analyze incoming agent traces with a lightweight language model. The process includes generating embeddings and clustering traces to understand how people use an agent, what they intend to do, how they feel about the interaction, and which issues they encounter. Hetzel connects this work to shortening the loop between finding a production problem and experimenting on a fix. He also describes observability and evaluations as the same underlying problem, with evaluations using known inputs in batch and observability handling unknown inputs in real time.