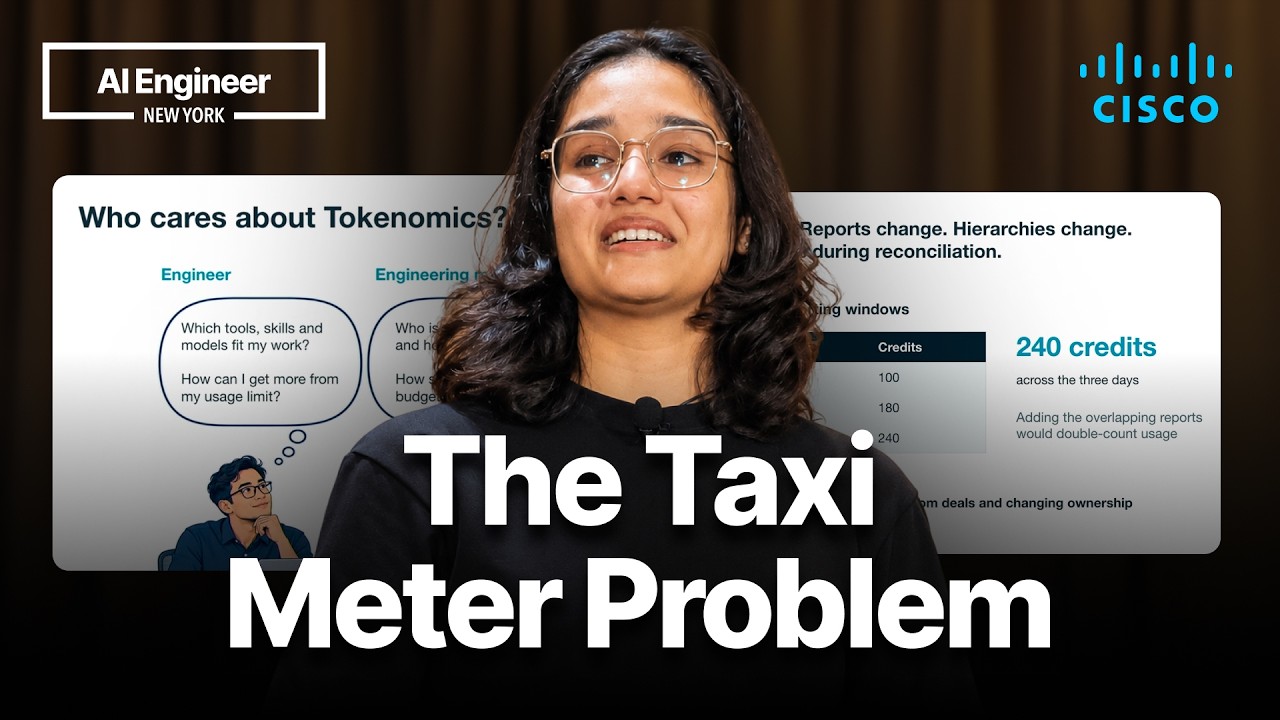
Tokenomics is the observability and interpretability of token usage and cost.
2
AI spending now needs to account for efficiency, custom provider pricing, and different needs across engineering and finance.
3
A useful tokenomics product combines provider data with company and finance hierarchies, while handling changing bills, users, and permissions.
Summary
Pratyusha Duvvuri defines tokenomics as the observability and interpretability of token usage and cost. She explains why the term means different things to engineers, engineering managers, and finance teams. Engineers need model and budget detail. Managers need adoption, trends, and comparisons between teams. Finance needs budgets, alerts, return on investment, and spend mapped to its own ownership structure. Provider dashboards do not combine data across vendors, and their initial bills can change after reconciliation. Duvvuri walks through a dashboard with cost, adoption, forecasting, organizational rollups, job-family views, model filters, and a separate finance hierarchy with access controls. Her team took the product from customer conversations to general availability in 10 weeks. She is honest about the difficult parts: provider pricing varies by customer, data changes over time, employees move, and one product must stay simple for very different audiences.
Tokenomics has different meanings across companies
Duvvuri asked about 100 companies and spoke with engineers, product managers, engineering managers, and CFOs. Their answers ranged from basic observability, such as knowing what tokens cost, to a full financial breakdown of return on investment for every team. She does not claim there is one universal definition. Instead, she offers a working version that can guide product decisions.
Duvvuri describes a change from treating high token usage as a status symbol toward asking whether model calls are efficient. In an internal Cisco use case, a cheaper model scored 96% in evaluations while a more expensive model scored 99%. The team kept the cheaper model for internal work. For customer-facing use, she says they might accept the extra cost for better customer satisfaction.
Model providers no longer have one simple pricing arrangement for every customer. Duvvuri describes agreements with different per-credit prices and thresholds, including contracts that charge nothing up to a limit and then apply a higher rate. This variation makes a shared view of token cost more useful than relying on a generic provider price list.
Engineers want to know which model to use, how much of a budget they have spent, and which skills or tools consume tokens. Engineering managers need adoption and trend data across teams, including cases where one team spends more while producing weaker results. Finance teams need budgets, alerts, return-on-investment information, and spend mapped to their own ownership structure.
Provider dashboards do not provide one accountable view
A company may have separate dashboards for OpenAI, Anthropic, GitHub Copilot, and other providers. Duvvuri says users must otherwise move between these systems, while the dashboards do not serve finance and management needs in the same way. Provider bills can also change after reconciliation. A bill initially shown as $100,000 might later become $120,000, so the combined system must update its records.
Tokenomics combines usage visibility with interpretation
Duvvuri defines tokenomics as "the observability and interpretability of token usage and cost." Interpretation includes return on investment, the set of models being used, and the right categories for a particular use case. The definition is deliberately broad because the useful product depends on what each audience needs to understand.
The product depends on organizational and provider data
The dashboard needs a company hierarchy from Workday, ADP, or a similar system, along with API keys and organization IDs for the model providers. It also needs the finance hierarchy, which differs from the management hierarchy. To limit sensitive workforce data, customers can provide a CSV with names, IDs, job functions, and other basic fields instead of their complete employee history.
The dashboard joins cost, adoption, forecasting, and ownership
The product lets users filter by time range, including a fiscal calendar. Its leader view contains separate cost and adoption dashboards, trend information, projected usage, organizational rollups, and consumption by job family. Users can inspect individual and team usage, compare groups such as sales and engineering, and filter by person, job function, model, or thinking pattern.
Changing data and multiple audiences make the system hard to build
Duvvuri names reconciliation as a major challenge because provider data can change after an earlier figure was presented. Employees and managers also change, which affects attribution. The system must handle large organizations and new product users while remaining simple for engineers, managers, and finance teams. Her team shipped the product to general availability in 10 weeks, after a demanding development sprint.